How UCLA DTS used data visualization to protect and assist thousands during the January 2025 wildfires
The Opportunity
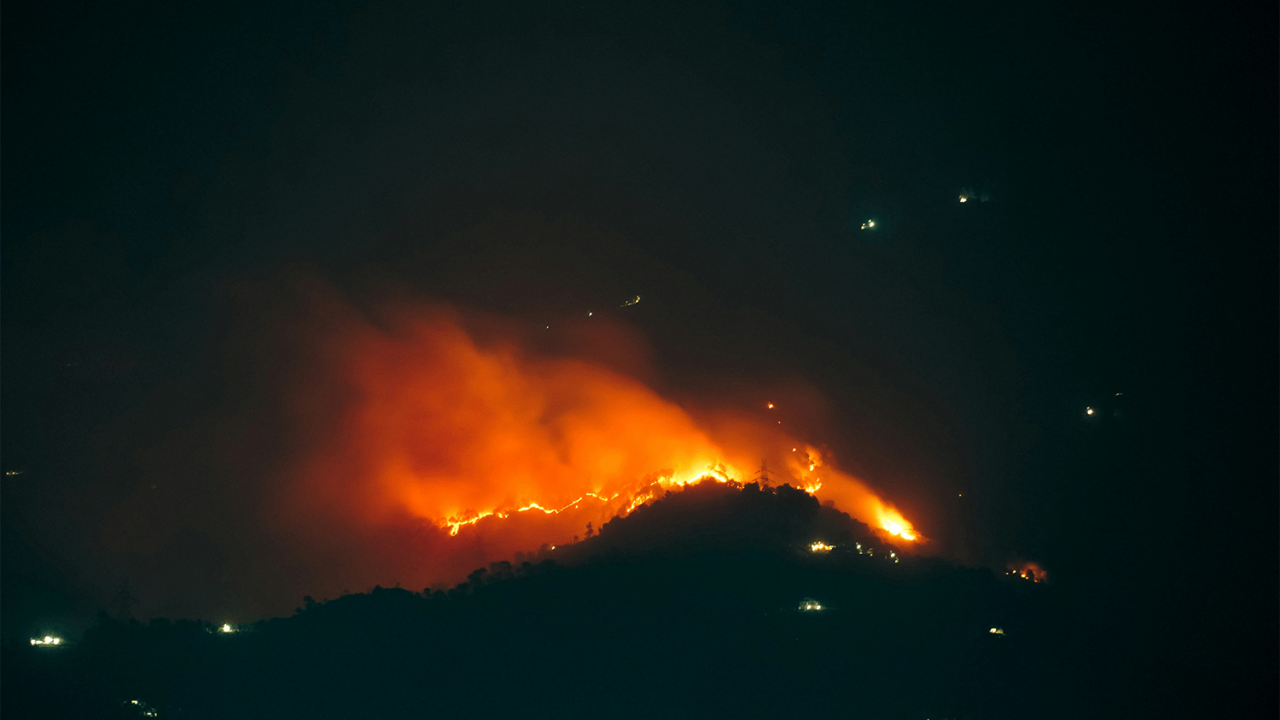
In January 2025, wildfires spread across Los Angeles, putting UCLA students, staff, and faculty at risk. With evacuation zones shifting rapidly, university leaders needed timely, accurate insight into who might be impacted.
UCLA Digital and Technology Solutions’ Enterprise Data & Analytics team quickly responded with a real-time wildfire dashboard. The tool gave leadership the visibility needed to coordinate outreach and support efforts effectively.
The Challenge
When asked, "Can we see who is impacted by the wildfires?", the answer was not readily available. The team faced three major hurdles:
- Population data in multiple internal systems
- Limited access to real-time external evacuation zone data
- Adresses requiring cleaning and geocoding to place on maps And with fires starting on January 7, there was no time to waste.
The Solution
A cross-functional team rapidly developed a set of dashboards to map wildfire impact across the UCLA community.
Data Integration
Over 93,000 campus addresses were geocoded and paired with shapefiles from the California Office of Emergency Services to reflect active evacuation zones.
Visualization and Filtering
Interactive Tableau dashboards allowed filters by department, student class, and evacuation level. Historical zone data was also incorporated to show wildfire progression over time.
Secure Access
Sensitive data was protected using Row Level Security, ensuring department leaders saw only their impacted employees. Access was provisioned quickly to enable immediate use.
Leadership Perspective
Chris Lechner, Director of Reporting and Analytics, noted:
"When the fires hit Los Angeles, it was a scary and uncertain time—but teams across UCLA came together in the best way: to support each other and care for the Bruin community."
The Impact
This effort changed how UCLA responds to emergencies:
- Identified over 3,300 individuals in active wildfire zones
- Enabled immediate outreach with accurate contact and emergency info
- Delivered 121 dashboard updates covering five major fires
Technology became a real-time ally in community support.
Looking Ahead
The same system is now ready to support future emergencies like earthquakes or floods. The process has shifted from reactive to proactive, giving UCLA a powerful tool for decision-making and outreach.
Mission Alignment
This work advanced UCLA’s mission of public service through innovation and collaboration. By merging internal and external data into a real-time tool, DTS helped protect the campus and demonstrated the role of technology in service of community resilience.
Timeline
- January 7: Wildfires begin
- January 9: First dashboard launched
- January 15: System stabilized with ongoing refreshes
- Within 48 hours: End-to-end data integration and deployment
This project reflects the power of teamwork and technology to make a meaningful impact in moments that matter most.
Learn more or explore collaboration opportunities with UCLA Digital & Technology Solutions.